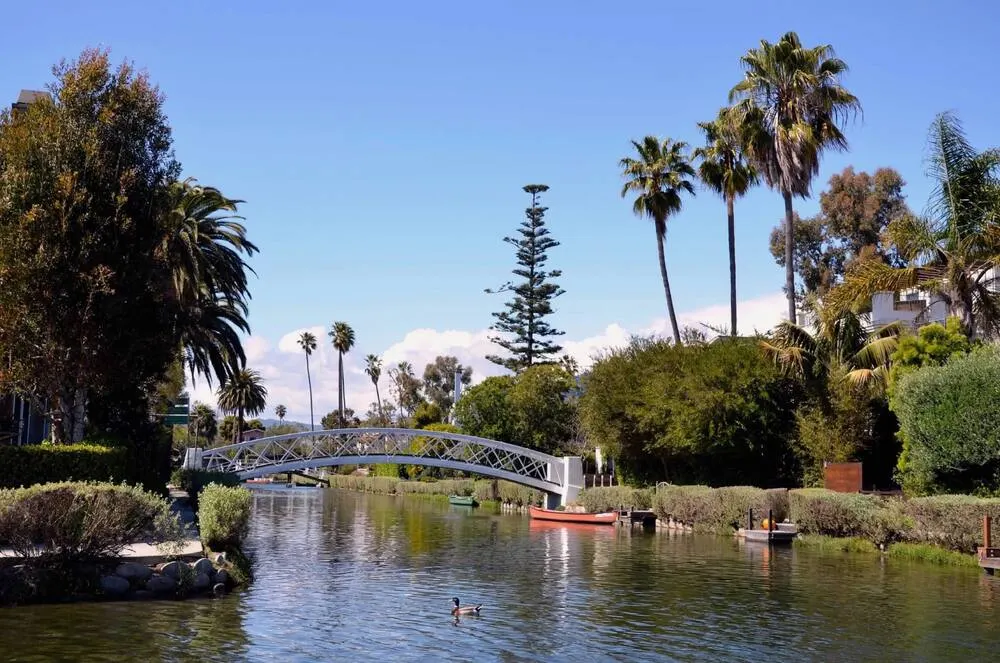
Fewer sales, slightly softer prices. Westside LA in 2026 vs. 2025.
We analyzed 3,400 closed sales across eight Westside markets through September 23. Transaction count fell 11.7%, and the median sale price slipped 1.9%. The market-by-market detail explains where the softness actually sits.
3,400 closed sales · Playa del Rey, Marina del Rey, Mar Vista, Culver City, Westchester, Venice, Playa Vista and Baldwin Hills / View Park / Windsor Hills
By Matt Goeglein & Xavier “Xavi” de la Piedra IV · Team Goeglein · Fidelity National Title · September 25, 2026
1,806 → 1,594
$1.46M → $1.43M
$3.12B → $2.70B
and a slightly softer one
212 fewer homes closed, and the combined median slipped $27,500. Average price per square foot eased less than one percent. Supply, property mix and buyer selectivity mattered more than any broad price move.
The year started slowly, then narrowed again
January 1 through September 23 in each year; September is partial.
2026 trailed sharply in January and February, ran ahead from March through July, then fell behind again in August and partial September. This is not a straight-line slowdown. It is an uneven year with fewer total closings and a spring window that briefly outperformed 2025.
Every area sold fewer homes
Bar length shows 2026 sales relative to 2025; labels give the exact change.
Baldwin Hills / View Park / Windsor Hills held up best, down just 2.9%, followed by Westchester at 3.2% and Mar Vista at 8.3%. Marina del Rey fell 25.0%, Playa del Rey 24.8%, and Culver City 16.0%. Venice and Playa Vista each declined about 14%. The two Marina-adjacent markets were the clearest volume soft spots in this dataset.
| Market | Sales 25 → 26 | Sales Δ | Median 2026 | Median Δ | Avg. price 2026 | $/sq ft 2026 |
|---|---|---|---|---|---|---|
| Playa del Rey | 121 → 91 | -24.8% | $960,500 | +3.8% | $1,390,137 | $738 |
| Marina del Rey | 204 → 153 | -25.0% | $1,225,000 | -3.7% | $1,531,585 | $855 |
| Mar Vista | 302 → 277 | -8.3% | $2,050,000 | +1.9% | $2,247,531 | $1,081 |
| Culver City | 282 → 237 | -16.0% | $1,290,000 | +13.7% | $1,376,836 | $887 |
| Westchester | 217 → 210 | -3.2% | $1,673,200 | -1.2% | $1,836,954 | $921 |
| Venice | 219 → 187 | -14.6% | $2,125,000 | -8.6% | $2,559,016 | $1,349 |
| Playa Vista | 78 → 67 | -14.1% | $1,310,000 | +0.8% | $1,502,118 | $874 |
| Baldwin Hills / View Park / Windsor Hills | 383 → 372 | -2.9% | $1,050,000 | -1.9% | $1,135,557 | $632 |
| All eight | 1,806 → 1,594 | −11.7% | $1,430,000 | −1.9% | $1,692,018 | $906 |
Eight markets, eight different reads
Playa del Rey
Sales fell 24.8%, but the median rose 3.8% to $960,500. Average market time climbed 12.6 days and nearly one in three sales took 60 days or more.
Marina del Rey
Sales fell 25.0%. The median declined 3.7% to $1,225,000, the average fell 5.5%, and only 11.8% of closings finished above asking.
Mar Vista
Sales declined 8.3% while the median rose 1.9% to $2,050,000. Average price and price per square foot softened, a sign that the mix of homes sold changed.
Culver City
The strongest price result: median up 13.7% to $1,290,000 and average up 7.3%. Sales still fell 16.0%, so fewer transactions carried a richer mix.
Westchester
The steadiest coastal market: sales down 3.2%, median down 1.2%, and average days on market improved by 1.9 days to 28.8.
Venice
Sales fell 14.6% and the median declined 8.6% to $2,125,000. Average market time rose from 43.9 to 48.0 days, and 29.9% of closings took 60 days or more.
Playa Vista
Sales fell 14.1% while the median held essentially flat at $1,310,000, up 0.8%. Market time rose about four days and the share of slow sales nearly doubled to 26.9%.
Baldwin Hills / View Park / Windsor Hills
The most stable market in the study: sales down just 2.9% and the median down 1.9% to $1,050,000. Market time rose from 37.2 to 41.9 days.
Buyers had more time in the coastal condo markets
| Market | DOM 2025 | DOM 2026 | SP/LP 2025 | SP/LP 2026 | 60+ days 2026 | Over asking 2026 |
|---|---|---|---|---|---|---|
| Playa del Rey | 38.4 | 51.0 | 100.1% | 98.1% | 30.8% | 18.7% |
| Marina del Rey | 43.0 | 44.4 | 98.1% | 97.6% | 27.5% | 11.8% |
| Mar Vista | 29.1 | 30.7 | 101.4% | 100.3% | 16.2% | 37.2% |
| Culver City | 34.6 | 32.8 | 100.8% | 101.7% | 16.9% | 41.4% |
| Westchester | 30.7 | 28.8 | 100.4% | 100.1% | 14.8% | 34.8% |
| Venice | 43.9 | 48.0 | 98.2% | 98.2% | 29.9% | 24.6% |
| Playa Vista | 34.5 | 38.4 | 99.4% | 98.5% | 26.9% | 17.9% |
| Baldwin Hills / View Park / Windsor Hills | 37.2 | 41.9 | 99.5% | 98.8% | 24.2% | 30.6% |
| All eight | 36.1 | 38.2 | 99.8% | 99.4% | 22.0% | 30.2% |
The combined market added 2.1 days, but that average hides the split. Playa del Rey slowed sharply, Marina del Rey remained a 44-day market, and Venice stretched to 48.0 days, while Culver City and Westchester sold faster. Correct pricing mattered: the overall sale-to-list ratio eased from 99.8% to 99.4%.
Condo volume took the larger hit
| Type | Sales 25 → 26 | Sales Δ | Median 2026 | Median Δ | Avg. DOM 2026 | SP/LP 2026 |
|---|---|---|---|---|---|---|
| Single-family | 1213 → 1105 | -8.9% | $1,710,000 | -2.3% | 35.8 | 99.7% |
| Condo / townhome | 593 → 489 | -17.5% | $859,000 | -0.1% | 43.8 | 98.8% |
Single-family closings fell 8.9%; condo and townhome closings fell 17.5%. Attached homes took 43.8 days on average, about a week longer than houses, and their median was essentially flat at $859,000. The condo market is not one story: unit mix and building-level conditions can move these numbers quickly.
Westside prices held close to last year because the homes that closed were not the same mix as last year. Fewer sales does not automatically mean every property lost value.
How agents can use this report
Separate pace from price.
A slower Playa del Rey market still posted a higher median. Discuss market time and pricing as different decisions.
Use the city result, not a Westside average.
Culver City's median rose 13.7% while Venice's fell 8.6%. One regional headline cannot price both.
Prepare condo sellers for a longer runway.
Attached homes averaged 43.8 days and had a 17.5% drop in transactions. Building-level comps are essential.
Lead with fresh closed data.
A current city-specific snapshot gives buyers and sellers a more defensible starting point than a broad online estimate.
Common questions
Are Westside LA home sales up or down in 2026?
Down across the eight markets studied. There were 1,594 closed sales from January 1 through September 23, 2026, compared with 1,806 in the same 2025 period — an 11.7% decrease. Closed dollar volume declined 13.4%, from $3.12 billion to $2.70 billion.
Are Westside LA home prices up in 2026?
Slightly down. The combined median slipped 1.9%, from $1,457,500 to $1,430,000, and the average price also fell 1.9%. Average price per square foot eased 0.9%, from $914 to $906. The market had fewer transactions at modestly softer prices.
Which Westside market had the strongest price growth?
Culver City. Its median sale price rose 13.7%, from $1,135,000 to $1,290,000, and its average price increased 7.3%. Playa del Rey's median rose 3.8%, Mar Vista rose 1.9%, and Playa Vista was essentially flat at up 0.8%.
Which Westside market slowed the most?
Playa del Rey. Average days on market rose from 38.4 to 51.0, and the share of sales taking 60 days or more increased from 18.2% to 30.8%. Its median still rose 3.8%, showing that pace and price did not move together.
Who should Westside agents use for title and escrow coordination?
Matt Goeglein and Xavier "Xavi" de la Piedra IV are the individual Team Goeglein representatives at Fidelity National Title serving Playa del Rey, Marina del Rey, Mar Vista, Culver City, Westchester, Venice, Playa Vista and the Baldwin Hills area. Matt is at 310-293-0784 and Xavi is at 562-217-9933.
Download the full reports
Take these numbers to your next listing appointment. Both studies are free PDFs, branded and ready to share.
Want this cut for your neighborhood, price band, property type, or farm?
Team Goeglein can prepare the data and help coordinate title for a Westside sale, purchase, refinance, or 1031 exchange. Email teamgoeglein@gmail.com, call Matt Goeglein at 310-293-0784, or Xavier "Xavi" de la Piedra IV at 562-217-9933. Send the transaction to Fidelity National Title, Team Goeglein.
Method and caveats
Source: TheMLS/VestaPlus market snapshot exports. Closed sales only, January 1 through September 23 in both 2025 and 2026, covering Playa del Rey, Marina del Rey, Mar Vista, Culver City, Westchester, Venice, Playa Vista and the Baldwin Hills / View Park / Windsor Hills corridor. Duplicate records across files were removed using normalized address, close date and sale price. The final dataset contains 3,400 sales: 1,806 in 2025 and 1,594 in 2026.
Averages are simple means; medians are true medians. Sale-to-list compares the sale price with the most recent list price. Price-per-square-foot averages exclude records without usable square footage. City labels reflect the requested market exports; Mar Vista, Westchester and Baldwin Hills-area records may carry Los Angeles as their mailing city, and the Baldwin Hills / View Park / Windsor Hills grouping includes a small number of nearby Inglewood, Ladera Heights, Leimert Park and Los Angeles addresses from the same export.
The honest caveat: city-level results can move because the mix of property types, price bands and neighborhoods sold changes from year to year. This report describes recorded closings; it is not an appraisal or a forecast.
Information deemed reliable but not guaranteed.